RUSSIAN ECONOMY OF WAR
How long can Russia sustain the war in Ukraine? 
Dr. Vlad Bernstein and ChatGPT
 
Russia's invasion of Ukraine in February 2022, referred to as the "special military operation" (SMO), was intended to capture Kyiv and change the government in Ukraine within a few days. After over 3 years of full-scale war, it is clear that the conflict has become a war of attrition, where the outcome depends on the rate at which each side exhausts its accumulated resources through war-related expenditures.
 
Unlike Ukraine, which receives approximately $80 billion annually in international aid (as reported by the Kiel Institute), Russia must rely entirely on its domestic economy to sustain its war effort. In 2025, Russia’s total additional war-related expenditures are estimated at no less than $140 billion per year, including $90 billion in military spending and $50 billion in losses due to sanctions.
 
At the onset of the invasion, following the seizure of approximately $300 billion in foreign currency reserves, Russia’s remaining accumulated resources were estimated at around $1.33 trillion. This included roughly $330 billion in residual foreign reserves, along with about $1 trillion in domestic financial holdings (primarily liquid or semi-liquid assets) divided between corporate accounts (60%) and personal accounts (40%). While not under direct state control, these domestic assets are considered accessible through taxation, monetary policy, or financial interventions, and thus represent a critical reserve for sustaining prolonged wartime spending.
 
During the first three years of the war, the Russian economy received an additional ~$200B windfall from the 2022 oil-price spike—effectively offset by a comparable capital outflow. Roughly $300B in strategic reserves was channeled into the military-industrial complex, lifting measured GDP by about 15%, allowing the state to cover incremental war costs without a major drop in average living standards, and leaving foreign-currency reserves nearly empty.
 
After exhausting its remaining currency reserves, Russia’s war effort has been financed exclusively from a pool of accumulated domestic resources, which are being depleted at an estimated rate of 13–15% per year, beginning in 2025. According to ChatGPT, this trajectory is expected to result in radical political change once accumulated resources decline by 20–30%, a threshold projected to be reached around 2027.
 
The interactive chart below presents a 10-year projection of Russia’s wealth trajectory, beginning with the onset of the full-scale invasion of Ukraine. Developed using the resource balancing methodology described below, it models both Aggressive and Conservative scenarios, shaped by user-adjustable input parameters provided beneath the chart.
 
Russian Wealth (Deposits) Trend 2022 - 2032
 
 
UpdateChart: Reset
Savings and Reserves


Resource Flows and Imbalance Calculation
Methodology
Unlike in peacetime, where economic forecasting is complicated by numerous competing factors, wartime conditions simplify the analysis by making military spending the dominant driver. A methodology that focuses on how resource imbalances affect accumulated reserves can yield reliable results, while bypassing the broader complexities of the economy.
 
Any economy can be represented as a system that produces and consumes resources. The fundamental behavior of such a system is governed by the law of conservation of energy, matter, and resources, which can be expressed by the following equation:
 
d(Savings)/dt = Income - Expense
 
Where:
 
   - Savings represents accumulated resources.
   - Income is the total flow of resources generated within the system or received externally.
   - Expense is the combined flow of resources consumed or lost.
 
In large, healthy economies, the imbalance between income and expense typically remains slightly positive, supporting steady annual savings growth of 3–4%. Accumulated resources are generally proportional to annual income (GDP), serving as a key indicator of national wealth. Using the methodology outlined above, wealth trends can be calculated based on the initial savings and the imbalance between resource inflows and outflows, as shown in the following equation:
 
Savings(t) = Initial Savings + d(Income(t)) - d(Expense(t))
 
In this equation, d(Income(t)) and d(Expense(t)) represent the imbalance between the initial and current resource flows as a function of time. The more detailed version of the equation above looks like:
 
Savings(t) = Initial Savings + d(Iprd) + d(Iexp) + d(Iin) - d(Econ) - d(Emil) - d(Eout)
Income:
- Iprd - Non-Military Production
- Iexp - Export of Natural Resources
- Iin - Capital Inflow (external aid)
Expense:
- Econ - Public Consumption
- Emil - Military Spending
- Eout - Capital Outflow
 
Now, lets take a look at each of the mentioned components for the Russian economy.
 
Non-Military Production
During wartime, non-military production typically remains stable, with some resources redirected toward military production, which could be partially compensated by the intensification of labor force. Thus, it would be reasonable to assume that the imbalance of Non-Military Production is close to zero.
 
Export of Natural Resources
Natural resource exports, particularly oil and gas, are critical to Russia’s economy, contributing about 15-20% of GDP and 40-50% of government revenue. Crude oil, petroleum products, and natural gas account for 50-60% of Russia’s total export revenue, making export profits highly dependent on global oil prices.
 
The chart below (generated by ChatGPT) illustrates the relationship between oil market prices and Russian export profits.
 
With pre-war Brent oil prices around $75 per barrel and a production cost of approximately $25 per barrel, Russia’s oil export profits totaled about $120B annually. Apart from the 2022 oil price surge (already accounted for as an extra reserve increase), prices remained stable through the end of 2024. Therefore, under the conservative scenario, it is reasonable to assume that the export resource flow will remain unchanged, resulting in a zero imbalance component.
 
However, multiple sources indicate that Saudi Arabia has ambitious plans to increase its oil exports from 7 million bpd to over 10 million bpd by the end of 2026. The chart below illustrates the oil prices required to maintain current profit levels as a function of export volumes for both Saudi Arabia and Russia.
 
The chart above suggests that Brent oil prices are likely to decline to around $65-70 p/b in the first quarter of 2025 and fall below $60 p/b by the end of 2026. Combined with the rising cost of Russian oil production from $20 p/b to approximately $40 p/b, this would create a significant drop in export profits. Assuming the market price on Brent oil drops to $50 p/b, the imbalance for the aggressive scenario comes to -$115B per year.
 
Export imbalance:
Conservative scenario: d(Iexp) = 0
Aggressive scenario: d(Iexp) = -$115B per year
 
Capital Inflow
In general discussions, “foreign aid” or “external investment” is often taken to include shipments of goods, regardless of whether they are part of commercial transactions. However, within the resource-balance model, trade or the exchange of goods does not drive the depletion of accumulated resources and therefore does not qualify as external aid. Unlike Ukraine, which receives about $80 billion per year in foreign assistance, the Russian economy relies exclusively on domestic resources, and external aid can be considered zero.
 
Public Consumption
Public consumption is closely tied to the level of accumulated savings, and naturally declines as these resources are depleted. In Russia, savings typically amount to approximately 50% of GDP, expressed as Savings ~ Econ. This relationship is integral to calculating the resource flow imbalance in public consumption.
 
Military Expenses
Russia’s military expenses include not only the official budget increase from $65 billion in 2021 to $145 billion in 2025, but also an additional 20% to 50% in indirect military-related spending (according to ChatGPT analysis). In the first three years of the conflict, these additional costs pushed total annual military expenditures to $96–120 billion. This dramatic surge created a significant resource flow imbalance, placing severe strain on Russia’s economy:
 
Conservative Scenario (20% indirect spending): d(Imil) = -$96B per year
Aggressive Scenario (50% indirect spending): d(Imil) = -$120B per year
 
Capital Outflow
Over the first two years of the war, capital outflows totaled about $280B. After the combat situation stabilized, roughly $80B returned to Russia, leaving a net outflow of about $200B.
 
Means of Financing the war
 
As Russia continues to grapple with prolonged economic pressures stemming from its wartime footing and international sanctions, the combined resource flow imbalance (Imb) in 2025 is estimated at $136 billion to $315 billion per year. Over three years of war, nearly all strategic government reserves have been depleted, leaving the state with one primary option to finance its military expenditures: extracting resources from corporate and private deposits. To address these ballooning expenditures, Russia employs three main mechanisms: Government Bonds, Increased Taxation, and Inflation.
 
Government Bonds
In 2024, approximately $60–90 billion was raised through bond sales, with significant participation from households and private institutions. While this approach avoids immediate taxation, it increases future financial obligations, as the government must repay these debts with interest. On average, the amount collected annually from the Russian population and domestic investors via government bonds is estimated at $75 billion.
 
Increased Taxation
The Russian government has implemented sweeping tax reforms targeting both individuals and corporations to boost revenues:
 
  • Income Tax Reforms: Estimated to generate an additional $6 billion annually.
  • Corporate Tax Hikes: With corporate taxes increased from 20% to 25%, an additional $18 billion was collected in 2024.
 
In total, the combined amount extracted from the population through taxation to finance the war amounts to $24 billion per year.
 
Inflation
After accounting for the resources extracted via government bonds and taxation—approximately $94 billion per year—the remaining resource gap of 136 - 94 = $42 billion to 315 - 94 = $221 billion per year is addressed through inflation. The equation describing this process would look like this:
 
M + S + E = B + T + (Hinf - Wgrw) * C / 100
Where
M - extra military spending (96-120 B/year )
S - effect of sanctions (40-80 B/year)
E - reduced exports profit (0-115 B/year)
B - government bonds sale (60-90 B/year)
T - extra money via increased taxation (24 B/year)
C - public spending (950-1000 B/year)
Hinf - household inflation (% per year)
Wgrw - wage growth (% per year)
 
The expected Household Price Inflation (Hinf) can be calculated as:
 
Hinf = Wgrw + 100 * (M + S + E - B - T)/C
 
The chart below shows the household inflation (Hinf) as a function of wage growth (Wgrw) for three sets of input values: Conservative, Medium and Aggressive.
 
Household Inflation as a function of wage growth rate
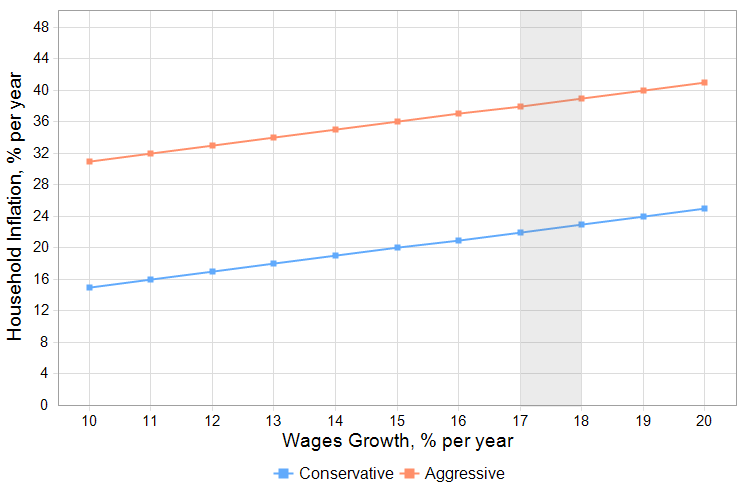
Conservative:  M = 96;  S = 40; E =   0; B = 60; T = 24; C = 950
Aggressive:    M = 120; S = 80; E = 115; B = 90; T = 24; C = 1000
 
The Medium line aligns well with the current trends observed in Russia: the wage growth rate in 2024 was around 17-18%, and household inflation, as reported by ROMIR (and lately by official sources) stands at approximately 21-22% per year. The chart suggests that household inflation could increase by as much as 37% if oil prices decline to $55 per barrel, assuming the wage growth rate remains unchanged.
 
Conclusion
The Russian invasion of Ukraine has not only highlighted the stark divide between authoritarian and democratic nations but has also underscored the critical importance of international support in maintaining global security. The ongoing conflict has demonstrated that reducing Russia's economic and military capabilities is essential to curbing its aggressive actions. This goal can be achieved through sustained international aid to Ukraine and strategic economic measures aimed at weakening Russia's resource base.
 
Ukraine's resilience, bolstered by consistent Western support, has shown that even in the face of significant military and economic challenges, a determined nation can effectively resist aggression. In stark contrast, Russia's isolated economy, constrained by limited resources, is unlikely to sustain the war for more than a few years.
 
During the first three years of the conflict, after Russia exhausted its strategic reserves that had temporarily sustained its economy and even allowed for slight growth, it entered a phase of steady decline in 2025. This decline is occurring at a rate of 13–16% per year, with projections suggesting it will accelerate further as oil prices are expected to drop.
 
The primary mechanisms for financing the war—issuing government bonds and raising taxes—are pushing household inflation to 21–22%, and, in the event of a significant drop in oil prices, could drive it to unsustainable levels of 30–40% annually. As a result, an internal regime change by the end of 2028 appears increasingly likely, driven by resource depletion and mounting domestic pressures.
 
Ultimately, the path to peace and stability lies in the continued commitment of the international community to support Ukraine and uphold the principles of sovereignty and democracy. By doing so, we can ensure that the sacrifices made in this conflict lead to a more secure and just world.
Powered by SiMX Target 5